
In the first of a two-part Q&A series, walking through the start-to-finish process for SkyX’s...
In the second of our two-part Q&A series, walking through the start-to-finish process for SkyX’s midstream pipeline integrity services, we sat down with Jason Braverman – Chief Technology Officer – to learn how UAV imagery gets turned into actionable data through AI-driven analysis.
If you missed it, read the first Q&A of our Midstream Pipeline Integrity Services series covering how data collection and flight operations play out on a pipeline right-of-way.
To start, tell us a bit about what you do at SkyX.
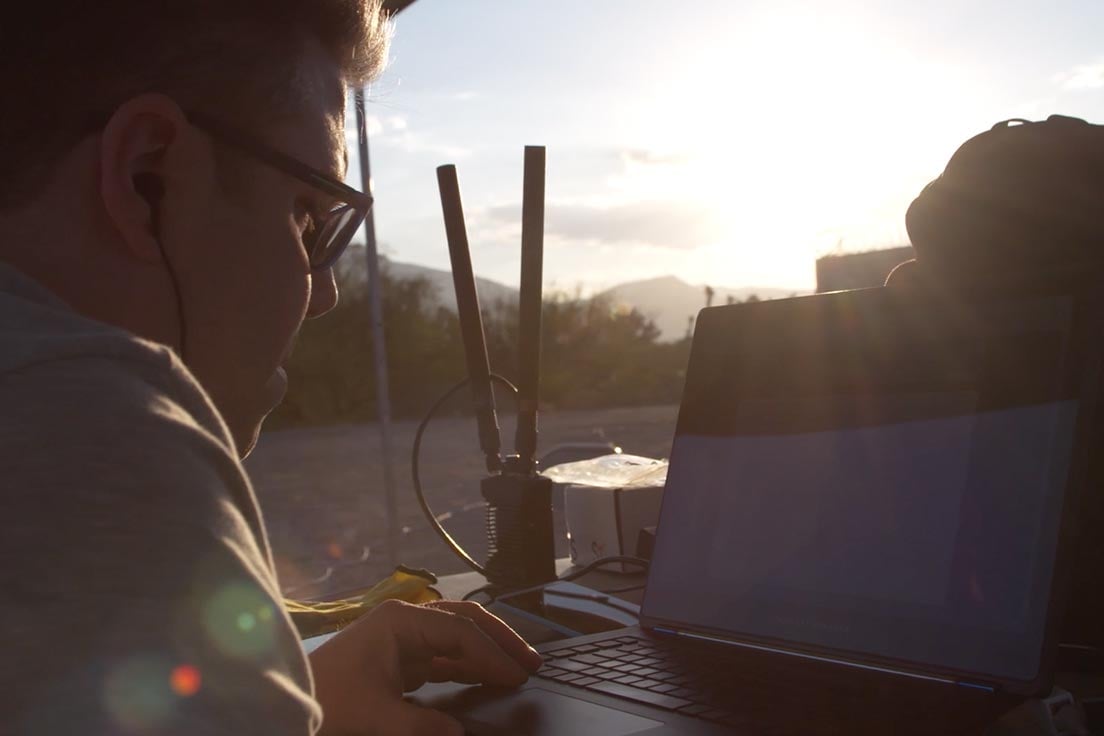
I am the Chief Technology Officer (CTO) of SkyX. From the ground stations to the aircraft, to the software that ties it all together – it’s my job to oversee all the technology we develop. I interact with our customers to identify where technology needs to change and what new things they need. And of course, I manage the team that builds and trains the AI and analytics component of our systems.
How does SkyX leverage AI in the data analysis process?
We use deep neural network models and algorithms to drive an intelligent and largely-automated computer vision analysis process.
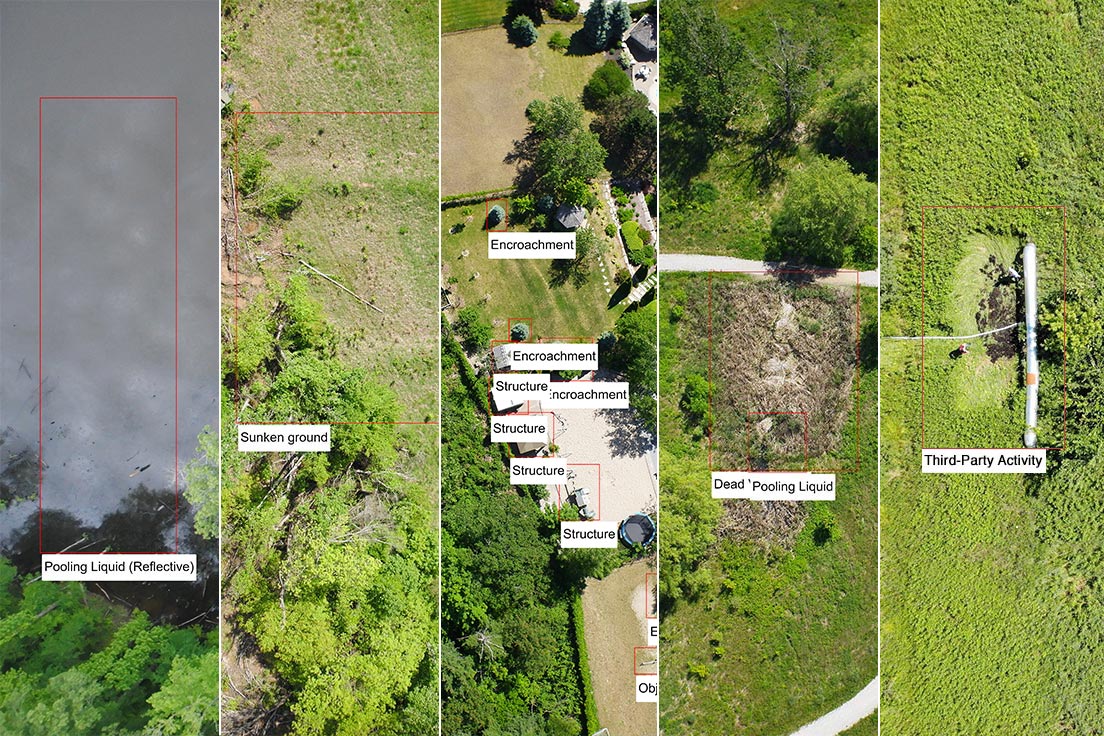
The first crucial component is the customized anomaly detector that we’ve developed and tuned to identify a variety of important anomalies along a pipeline Right-Of-Way (ROW) – such as:
- Pools of oil, discolored ground, dead vegetation, and other signs of pipeline failure.
- Ground movement such as sinkholes, cracks, or major instances of ground loss from a landslide.
- Anomalies related to third-party activity like people, vehicles, structures, and construction/excavation-related activity.
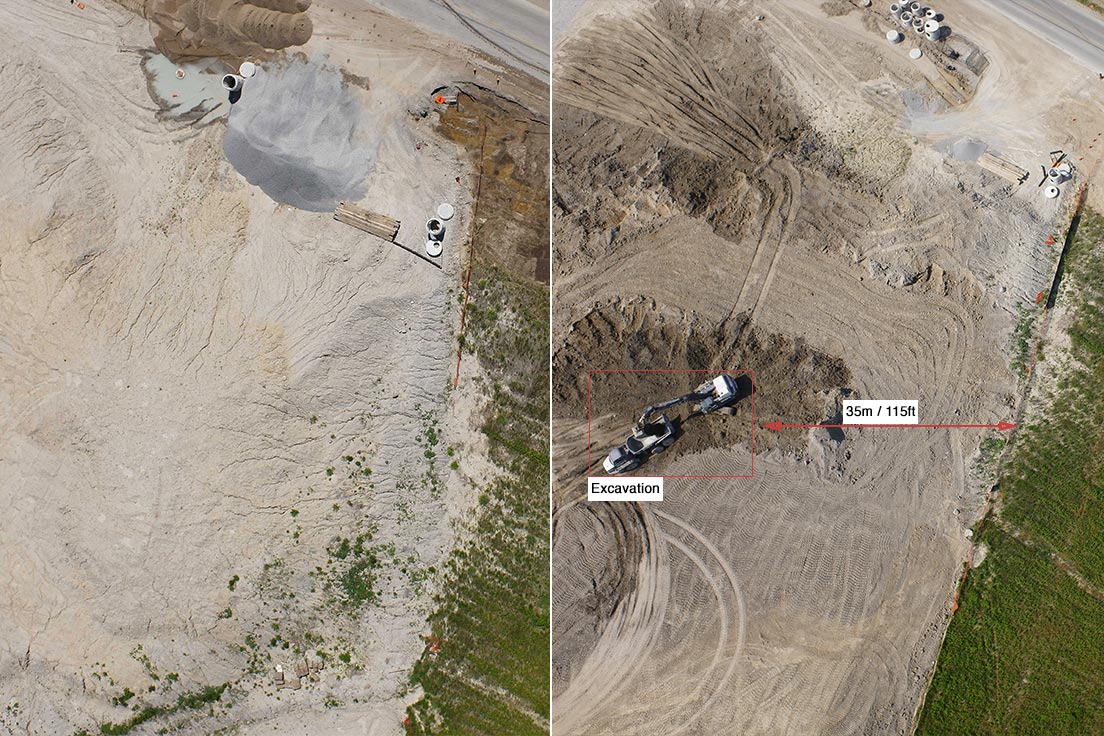
The next major piece of our analysis efforts is our change detection system, that comes together through a few moving parts:
- A right-of-way localization model that identifies the border of the ROW using edge detection.
- An algorithm to match, crop and normalize ROW images from different inspections down to the same geospatial location for comparison.
- A fully convolutional differential detector model to identify the changes between two given images of a ROW that were taken during separate inspections.
- An algorithm to visually map the nature of these changes for the end-user
Through this AI-driven computer vision analysis, we reduce the need for human involvement down to a final step of verification.
Expand on this concept of human + AI and how it benefits our customers.
Yes, this all comes down to how we hone-in on those critical points of data that are really valuable in managing a midstream pipeline – spills, illegal construction, or anything else that shouldn’t be happening on your ROW. Machine learning for computer vision applications is still an early-stage technology that needs a helping human hand to get your data over the finish line. So, we work with your subject matter experts to validate potential anomalies. These models are trained on data, and this human feedback allows the system to refine its understanding of how certain issues are going to look along your pipeline. At the end of the day, you’re crafting a system that’s specifically trained to report on issues important to you.
With these data points in hand, we can start to build predictive analytics that help you forecast future hazards to your pipeline.
What are predictive analytics and how do we use this aerial data process to deliver valuable data like this to customers?
Well, predictive analytics are a way of using key points of data from the past and present, to make an informed prediction about what you’re likely to see in the future. When we talk about the aerial data process, it’s how the UAV image sourcing, AI-driven analysis, and final human verification comes together to create valuable, standardized metrics around what you’re seeing visually on your pipeline.
This manifests as a four-step process:
- Collect a series of baseline data on the pipeline segment. We do a complete inspection of the ROW and meticulously review the raw image data, potential anomalies we pick-up, and find the things that are interesting to you and the things we’ll generally discard. This then gives us a clean slate to compare future inspections against.
- Change detection between new and historical data. Just as important as being able to detect an object or anomaly, is the ability to notice something that wasn’t there the last time you flew. With change detection, we can see subtle developing issues – such as vegetation encroachment – or how an anomaly is evolving with each inspection – such as a growing instance of erosion.
- Pinpointing those critical points with the human + AI equation. These are the where, what, when, and why that the predictive models are primarily based around.
- Then at the last stage, our predictive model starts to aggregate what we’re seeing over time to forecast trends and hotspots. Along a pipeline spanning hundreds of miles, we can identify concentrated areas for issues like leaks, land erosion, third-party activity, or whatever else – and provide a probability of additional occurrences in the future. We can also track the rate of expansion of gradual issues – like a growing sinkhole or encroaching construction – and forecast how they’re likely to look over time. These are then provided to the end-user as analytical data, which show predictions with varying percentages of probability.
Explain the ways predictive analytics can help pipeline integrity managers in their day-to-day operations.
Well, we’re talking about managing a midstream oil & gas pipeline, these are assets that span hundreds or thousands of miles. Knowing where you can focus resources and personnel to make effective preventative maintenance decisions is an absolute game-changer for an operator. This is a new opportunity in the industry, and we’re still working to quantify the value savings. However, when you consider how this can help you shift from generalized to targeted maintenance and ultimately eliminate critical operation-halting issues – it’s easy to picture how significant an impact predictive analytics will make on your bottom line.
Of course, these models become much more powerful when you layer-in the other data you’re working with. Point sensors from your SCADA system, in-line PIG inspections, even third-party data from weather forecasts – overlaying this on what we’re collecting from the skies allows you to paint a holistic picture of your pipeline integrity. Say you have a section on your ROW that’s more susceptible to ground surface issues such as erosion, bank stability, and landslides. Factoring in the potential for increased weather activity in this area – say an El Nino is occurring in the coming year – can help the model adjust anomaly probability accordingly.
Ultimately, by adding SkyX’s midstream pipeline integrity services to your maintenance program, we’re going to help you realize this whole process. We’re going to gather the data on a routine basis, run it through analysis leveraging AI, work with you to refine it, and unlock these predictive insights. The end result is you save a lot of money and prevent critical failures, because you’re able to apply the necessary maintenance ahead of time, based on the dat
Have questions about how high-quality aerial data can elevate your organization?
Contact our team to discuss your unique challenges and data requirements.